HttpLogBrowser - Screenshots
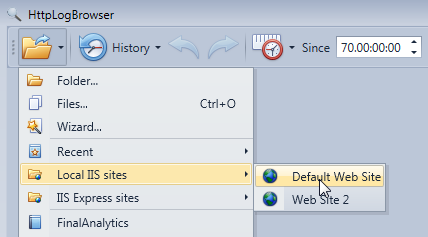
You can choose how to select log files to load in the Files menu. Saved profiles or local IIS web sites can be loaded directly.
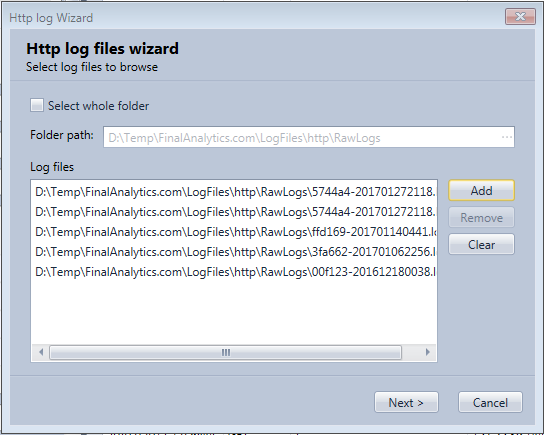
In the wizard, you can select either a whole folder or selected files to analyze.
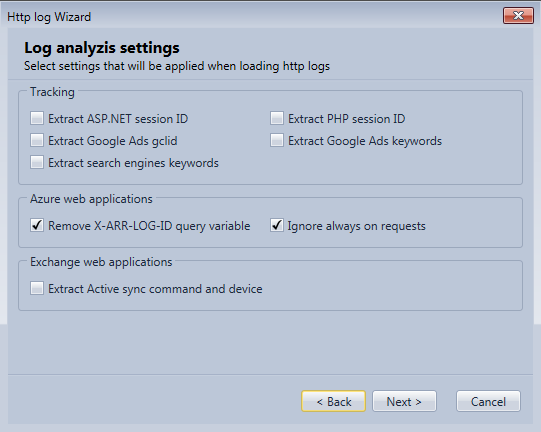
In the wizard you can specify settings to use when loading log rows.
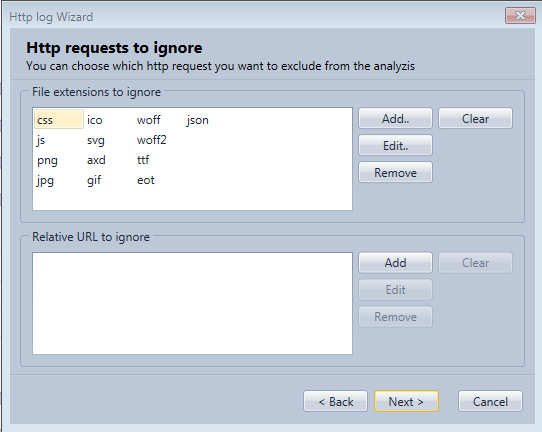
In the wizard, you can specify log rows that need to be ignored.
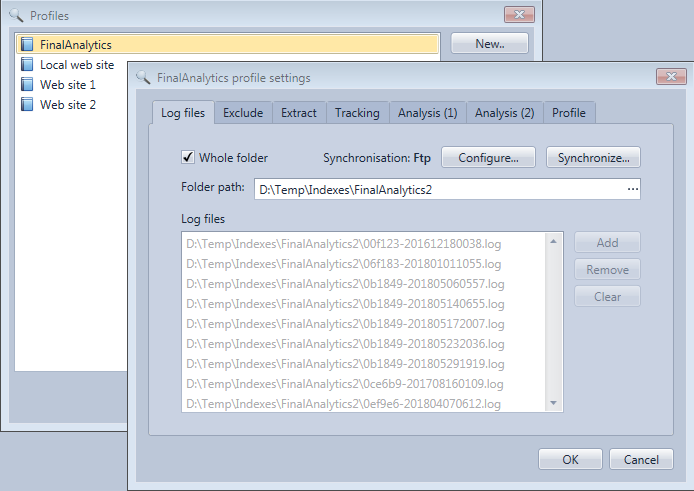
You can manage profiles with log settings for the web sites you regularly analyze
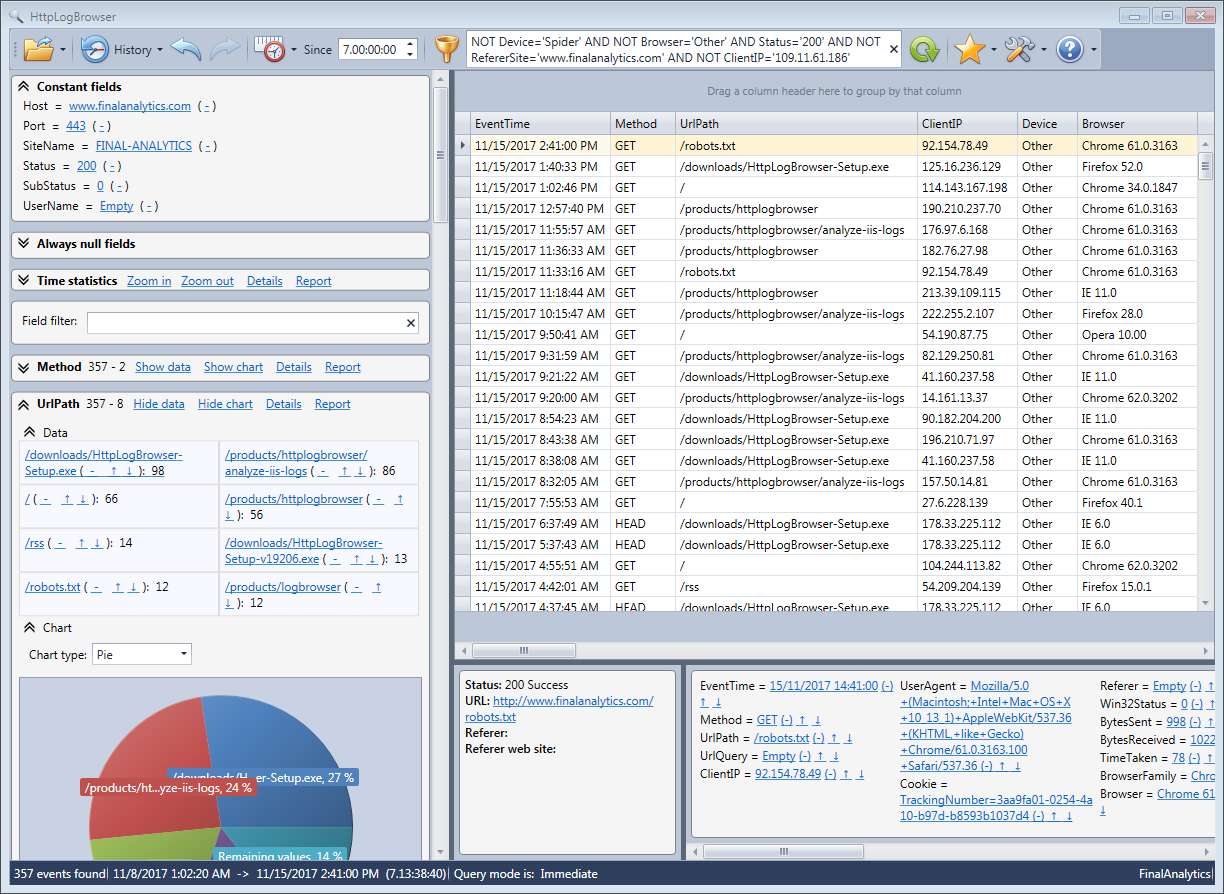
Main view after filtering down log rows. In the left upper corner you see fields that always have the same value. Just below you see the statistics for all other fields and a pie chart can be displayed for each field. In the right you see the log rows and below a detail panel for the selected row.
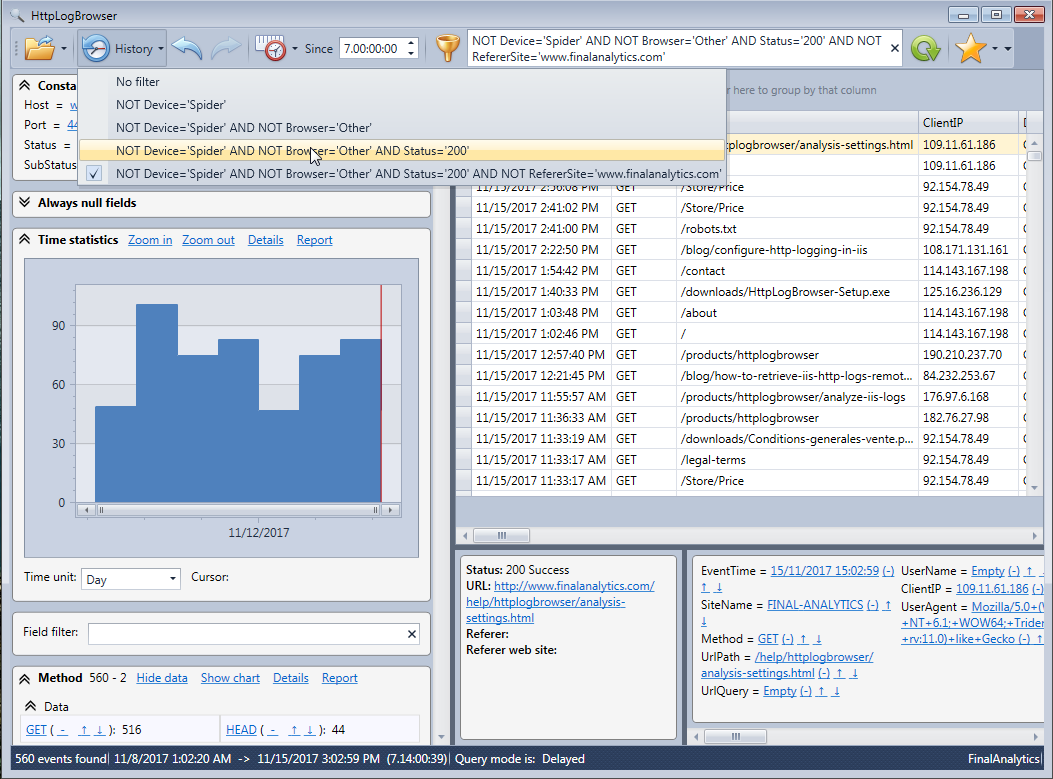
You can go back and display previous search with the history menu. The time statistics evolution chart has been expanded.
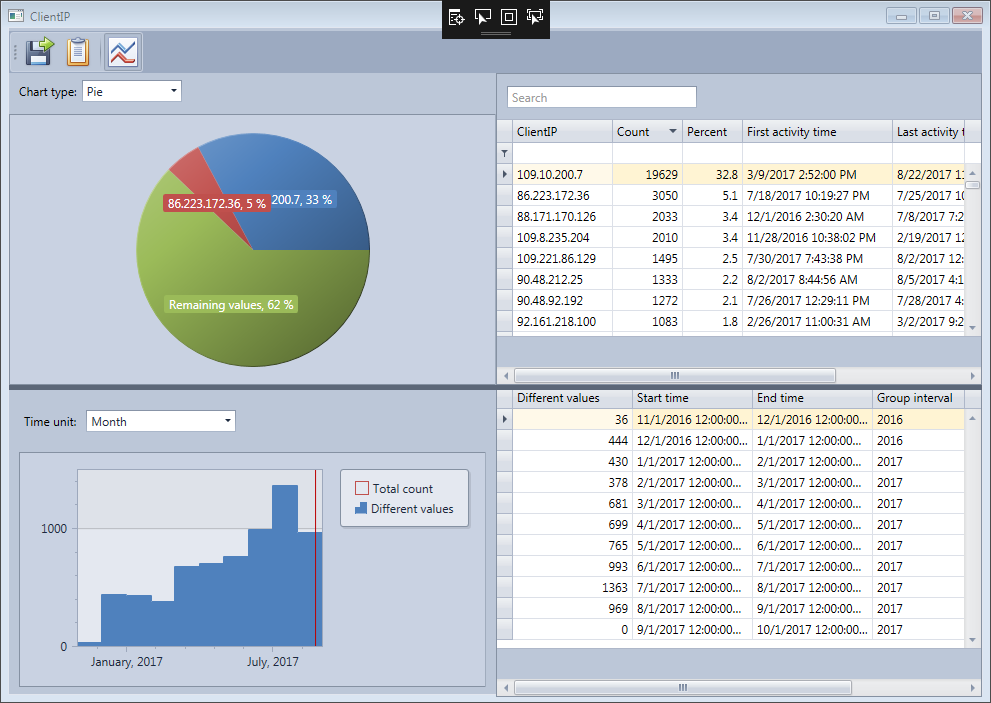
Detailed field statistics window for the client IP address. We can see the evolution of the number of different IP addresses accessing the web site.