What's new in HttpLogBrowser 4.5
You'll find hereafter the list of all new features in the free edition and the professional edition of the version 4.5 of the HttpLogBrowser.
Free edition
New time measure units
In previous version you had hour, minute and second as time unit lower than the day. So you had a big ratio between them: 1 day = 24 hours,1 hour = 60 minutes,1 minute = 60 s. So the number of bars was sometime too big and sometime to low in time histograms.
The following new time measure units have been added: 6 hours, 15 minutes, 5 seconds, 15 seconds, 5 seconds
Now the ratio is never greater than 4 so during a time zoom the measure unit will be selected more adequately.

New time selection modes
In previous versions it could take you some time to define the time selection when you were interested in a specific period of the calendar. Now you have several time selection modes that will help you in this way.
Since time periods
Once you have selected this mode in the time selection menu you can easily select a number of day, weeks, months, quarters or years since then you want to show data.

Predefined
If you select the predefined mode you can select Today, Yesterday, Current week, Previous week, Current month, Previous month, Current quarter, Previous quarter, Current year, Previous year as time selection.

Apply specific time period
If you want to select a specific period in the calendar, go in the Apply sub menu of the time selection menu and select the week, month quarter, year you are interested in.

Once applied you see the new calculated boundaries (Example hereafter for May 2020)
![]()
New TimeSpan fields
In previous versions you already had with the settings Extract day of week and hour of day the fields DayOfWeek and HourOfDay allowing you to determine the average activity respectively in a day of the week or in an hour of the day. However you could not have a better time precision.
Now these fields have been replaced by the new fields TimeOfWeek and HourOfDay. These new fields have no longer a time precision limit. If you zoom in the histogram the measure unit will be selected adequately or you can select the unit of your choice.
This is usefull for example to determine when in a week a web site has the least activity to schedule a maintenance operation.

The field SinceDays (Number of days since the landing) already present in previous versions if you enabled the Tracking field also get this improvement (Time resolution higher than the day). So you can use it to know how long visitors remain on the web site.
If you select the Pie chart mode for the field TimeOfWeek you will get the day activity breakdown in the week like hereafter.

Support of the IIS advanced logging module
The IIS advanced logging module is an add-on to IIS allowing to log custom fields for http requests. The generated log files have the same format (W3C) as the standard IIS logging with some subtle differences that were disallowing previous versions of the HttpLogBrowser load these logs. This is now fixed.
Active cursor in field evolution charts
You can now change the selected row by moving the cursor in time evolution charts (different values/average/sum evolution/ ) in detailed field statistics. Previously this was only possible in time statistics (number of requests by unit of time).

Merge all google domain extensions.
Google uses a different extension for every country. This makes it difficult to quantify the web activity generated by google landings with the referrer field. Now you can replace the country specific extension (.fr, .de, .co.uk, …) by .com for all google referrer domains.

When you select this option you will get statistics like in the following screenshot for the RefererSite field.

Instead of that (google landing activity spread over many referrer web sites)

Professional edition
Dynamic log file loading
What is critical when you want to analyze the logs of a big web site is the speed to load and query the log lines.
An improvement has been made in this way in the professional edition. If you select a whole folder to be loaded with all logs of a specific web site the application will no longer load all log files until the maximum number of days to load is reached. The application will use the time window configured in the filter and load only concerned log files. If the time window is extended missing log files will be automatically loaded.
This will speed up the load time and also the filter time because the filter will be applied to fewer rows.
This can dramatically speed up the performance when you are interested to analyze only a small time window.
Important! This mode will be activated only if you don’t use the tracking field or the multiple log folders settings. If you want a similar behavior with these settings it is recommended to use the database mode that can already natively load only filtered log rows.
Database favorite filters
When you use a database profile with a SQL Server or MySQL/MariaDB database you can share the logs of a web site with other users. They just need to create a read only database profile that point to the database in their instance of the HttpLogbrowser.
Now you can even store favorite filters in the database allowing other users to filter the shared logs with your filters.

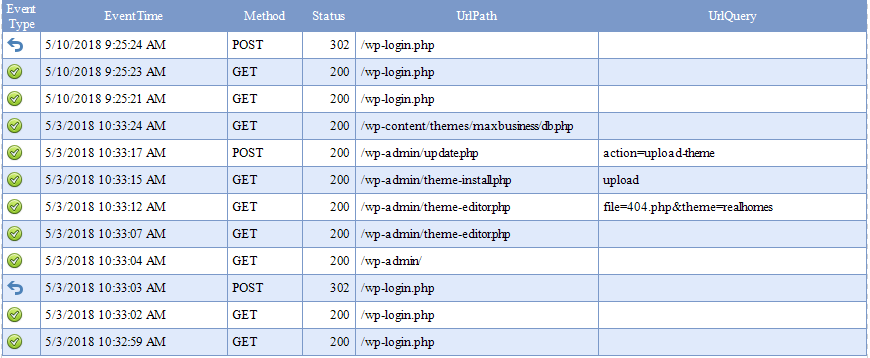
Web requests report
In previous versions it was already possible to generate statistics reports. Now you can also generate a printable report of the filtered web request events. The six first columns of the view are automatically included in the report and the column widths in the report are based on the column widths in the datagrid. So to customize columns in the report you just need to move arround and resize columns in the datagrid. The report header also shows the filter settings, all constant fields with their value and the list of fields that are always null.
See an example of report in PDF.